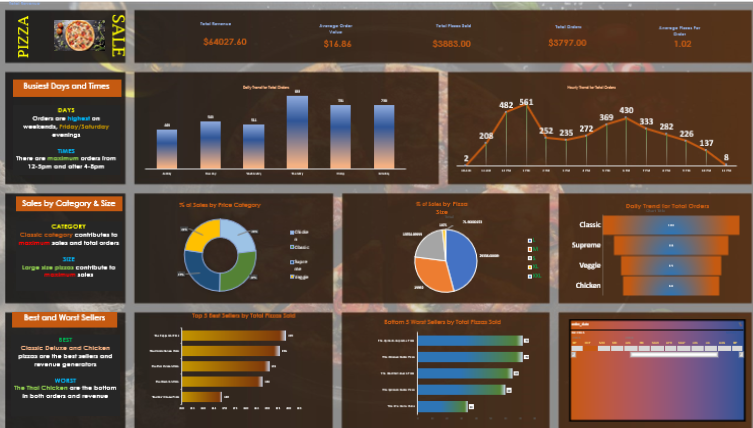
SQL and Excel Project with interactive dashboard
In this project, I begun by importing data to MS SQL Server Database Management, creating a Dababase, writing simple and complex SQL queries and lastly, creating a SQL document. The project focused on data cleaning, processing, analysis and dashboard creation in Excel.
SQL Data Cleaning Project

Project Introduction: The SQL data cleaning project involved analyzing a dataset related to Nashville housing. This dataset was sourced from a real estate database, aiming to improve data quality and consistency for better insights. Problem Definition: The analysis addressed issues such as inconsistent date formats, missing property addresses, and data duplication, aiming to enhance the accuracy and completeness of the housing dataset. Steps and Tools: Utilized SQL queries for data manipulation and transformation. Standardized date formats, filled missing property addresses, and addressed duplication using CTEs and various SQL functions. Microsoft SQL Server Management Studio was chosen for its robust query capabilities. Welcome to my Tableau Visualizations Portfolio, where data transforms into captivating stories and insights. As a passionate data enthusiast with a keen eye for translating raw information into visually engaging and meaningful dashboards.
Tableau Projects
Welcome to my Tableau Visualizations Portfolio, where data transforms into captivating stories and insights. As a passionate data enthusiast with a keen eye for translating raw information into visually engaging and meaningful dashboards. In a world inundated with data, the ability to distill complex information into clear, actionable visuals is a skill that sets professionals apart. Throughout my career, I have honed this skill using Tableau, a powerful tool that allows me to weave narratives, uncover patterns, and make data-driven decisions more accessible. This portfolio is a curated collection of my most impactful Tableau visualizations, each a testament to my dedication to turning data into a powerful asset for organizations. From interactive dashboards that reveal trends at a glance to compelling data stories that drive decision-making, these visualizations showcase my ability to convey the story behind the numbers..
Location
Nairobi, Kenya
Phone
Social
- © Untitled
- Design: HTML5 UP